Conventional wisdom says Washington empties out in August. Congress leaves. The motorcades thin. The city exhales. But after more than twenty years in this market, I can tell you that August is one of the most revealing months of the year, because the buyers who stay are the serious ones.
Fewer DC sales than 2019, far more money at the top, and a fall selling season three weeks shorter than usual.
The Kimberly Casey Team
The Washington Insider
August 2026 Issue
Power Players Purchase in the Summer.
Welcome to August in Washington.
Conventional wisdom says Washington empties out in August. Congress leaves. The motorcades thin. The city exhales. But after more than twenty years in this market, I can tell you that August is one of the most revealing months of the year, because the buyers who stay are the serious ones.
While much of the city is at the beach, disciplined buyers are touring quietly, sellers are preparing their homes for the fall, and some of the best deals of the year are coming together without a headline in sight.
“August is when disciplined buyers do their best work. The noise leaves town. The opportunities don’t.”
Kimberly Casey · Senior Vice President, TTR Sotheby’s International Realty
In this issue: what eight years of Bright MLS data reveal about a city doing fewer deals with far more money concentrated at the top, why TTR Sotheby’s holds the #1 position at the highest price points, and my read on a fall selling season that is three weeks shorter than usual this year.
Market Snapshot
The Data Doesn’t Lie. A Smaller, More Top Heavy Market.
Let’s begin with the numbers, because numbers are where the story lives. Eight years of Bright MLS transaction data, comparing the identical January 1 to August 14 window each year, tell a story more interesting than a good season. Washington is doing fewer deals than it did in 2019, and a far larger share of the money is moving at the top.
4,013
DC Sales · Jan 1 to Aug 14, 2026
31.6%
Fewer Transactions Than the Same 2019 Window
27.1%
Of Dollar Volume Is $2M+ · Was 9.8% in 2019
+30.5%
Average Price Since 2019 · Median Rose 16.4%
Read those together and the shift is unmistakable. Nearly three of every ten dollars spent on a Washington home this year went to a property above two million. In 2019 it was fewer than one in ten. Homes above one million now account for 28.7 percent of all transactions, up from 16.8 percent, and for well over half of every dollar that changes hands. The average sale price has climbed almost twice as fast as the median, which is what happens when the top of a market pulls away from the middle rather than the whole market rising together.
The citywide median also hides two very different markets. Single family homes are averaging $1,175,000 this year, with 43.7 percent of them trading above a million. Condominiums and co ops are averaging $578,000, with 8.4 percent above a million. Anyone reading one number for “the DC market” is reading the average of two markets that no longer behave alike.
This is why representation at the top of the market matters more than it did five years ago. Fewer homes are trading, and the ones that do carry more weight. That is not a reason to wait. It is a reason to be precise.
Washington, DC closed residential sales, January 1 to August 14, 2019 through 2026. Source: Bright MLS. 2026 reflects partial year data; every comparison uses the identical calendar window to remove seasonality.
Market Leadership
#1 Where It Counts Most
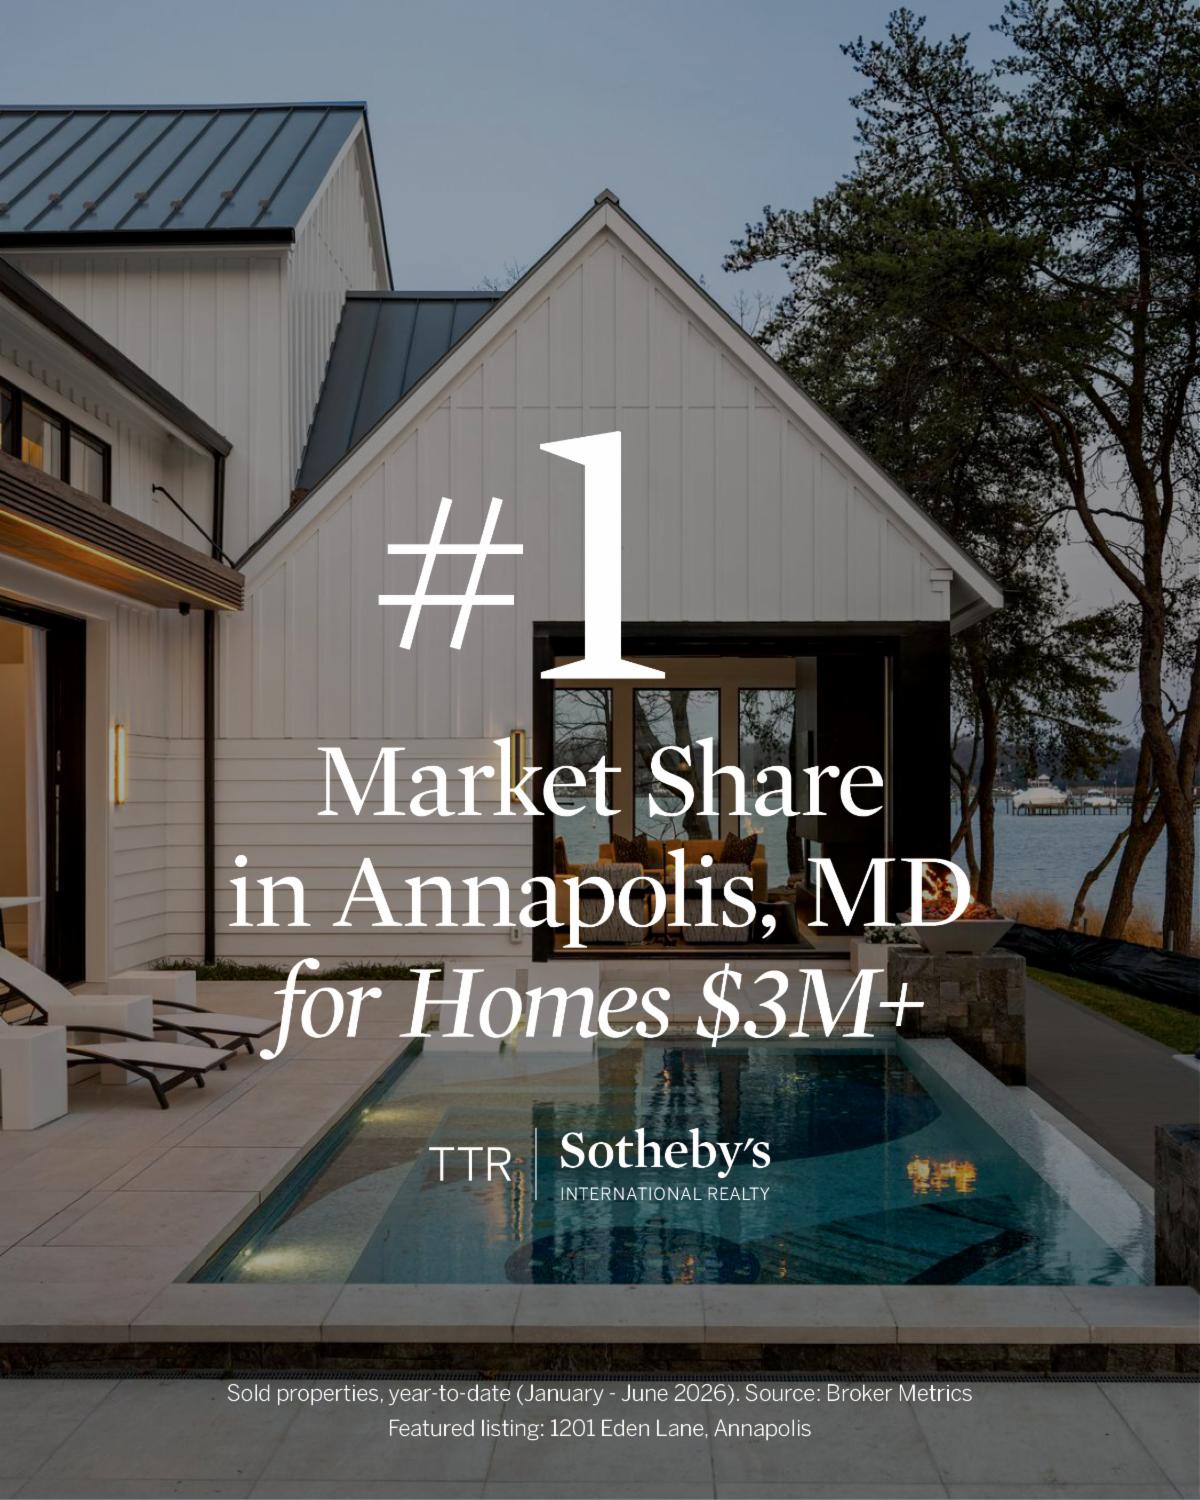
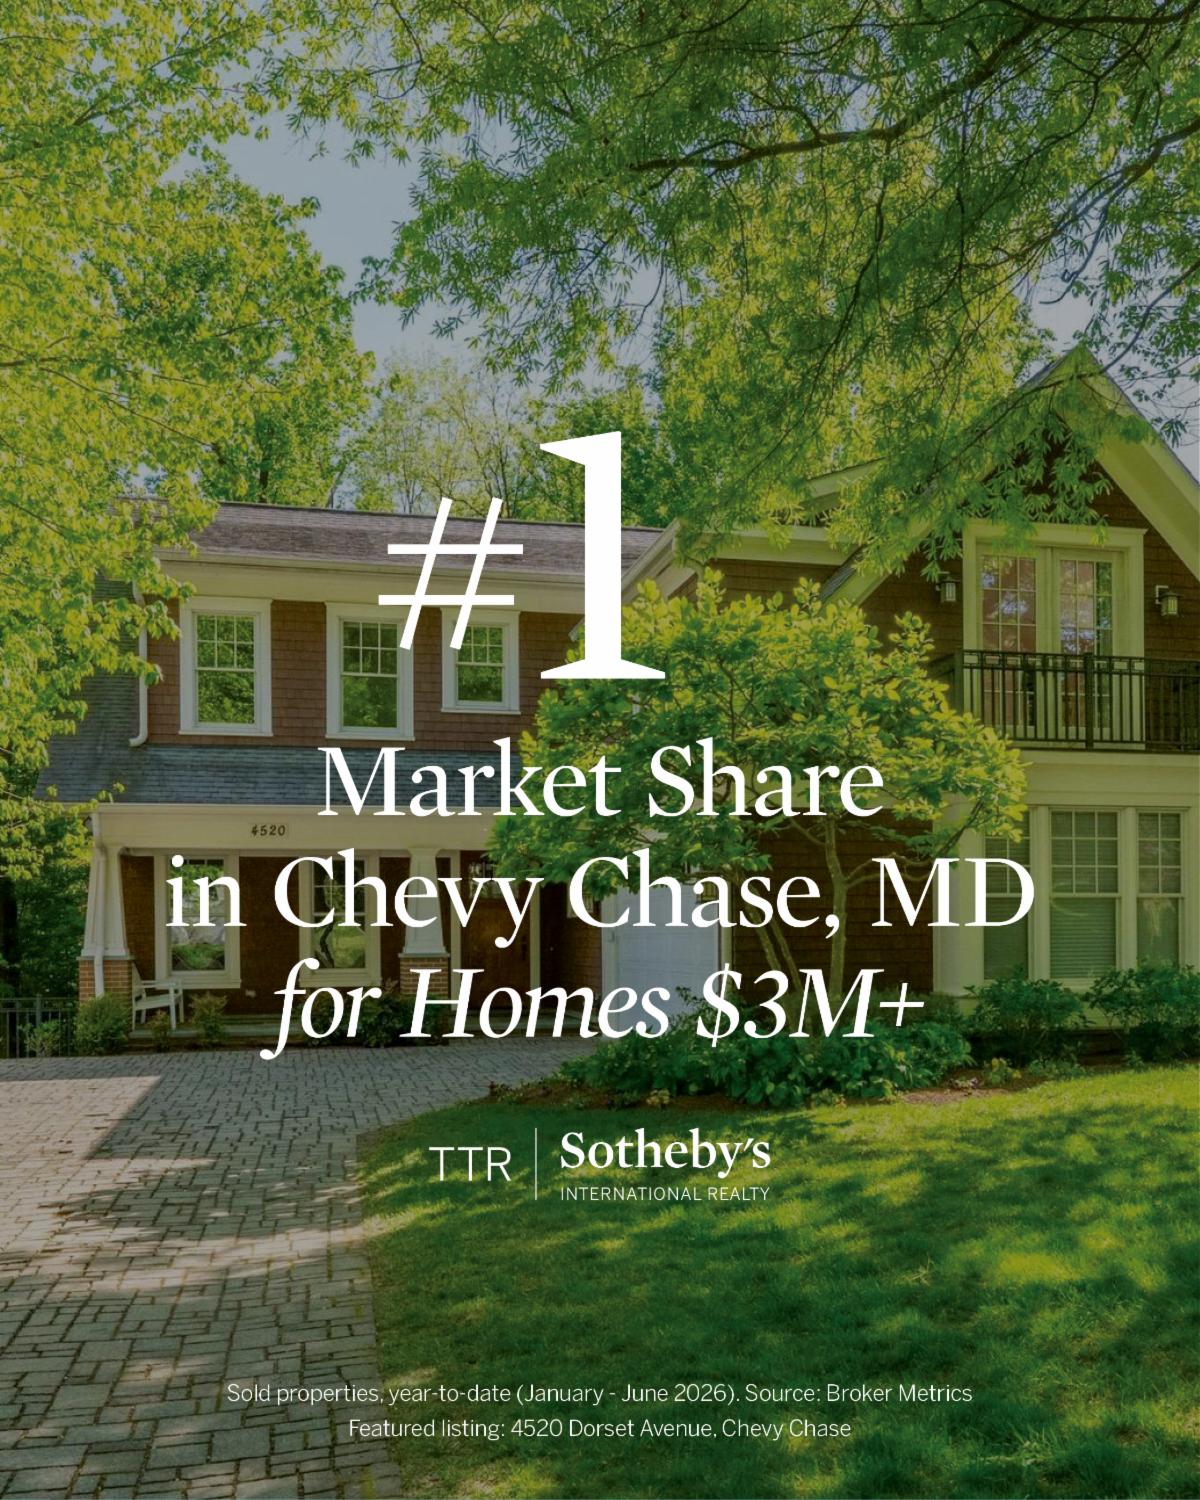
At the top of the market, one name leads. TTR Sotheby’s International Realty holds the #1 market share for luxury homes across the region’s most sought after communities, and the numbers at the highest price points tell the clearest story of all.
49%
Market Share on Homes Sold $4M and Above
Nearly half of every luxury home sold at the top of this market carries the TTR Sotheby’s name.